
PRODUCT MANAGER - ASSETS & CARDS - PPCBL Complete Preparation Guide & Solved Questions (2026) - Apex Rankers
Direct Departmental Recruitment Examination Syllabus & Question Bank
Accounting & Corporate Finance
50%Quantitative Aptitude Test
30%English Language Comprehension
10%Quantitative Aptitude Test
10%You have studied the complete question pool with step-by-step rationales. Ready to test yourself?
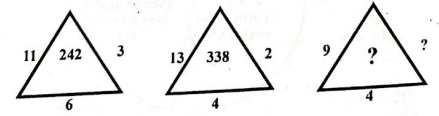
Right vertex: \(\frac{6}{2} = \mathbf{3}\)
Center: \(11^2 \times 2 = 121 \times 2 = \mathbf{242}\)
Triangle 2:
Right vertex: \(\frac{4}{2} = \mathbf{2}\)
Center: \(13^2 \times 2 = 169 \times 2 = \mathbf{338}\)
Solving for Triangle 3
Using the same pattern where \(\text{Left} = 9\) and \(\text{Bottom} = 4\):
Find the right side (?): \(\text{Right}=\frac{4}{2}=\mathbf{2}\)
Find the center (?): \(\text{Center}=9^{2}\times 2=81\times 2=\mathbf{162}\)
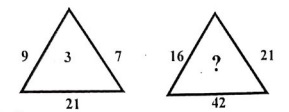
The number in the center is found by multiplying the left and right numbers together, then dividing by the bottom number:
\(\text{Center}=\frac{\text{Left}\times \text{Right}}{\text{Bottom}}\)
Verification
First Triangle:
\(\frac{9\times 7}{21}=\frac{63}{21}=\mathbf{3}\)
Solving for the Second TriangleSecond Triangle:
\(\frac{16\times 21}{42}=\frac{336}{42}=\mathbf{8}\)
First Right Turn: Facing South, turning right at a right angle makes him face West.
Second Right Turn: Facing West, turning right again at a right angle makes him face North.
Cash discount:
1800×0.98=1764.

\(21.3 - 20.8 = 0.5\text{ units}\)
Annual rate of increase: \(\frac{0.5}{3} \approx 0.1667\text{ units per year}\)
Time span from 1965 to 2000: \(2000 - 1965 = 35\text{ years}\)
Total projected increase by 2000: \(35 \times 0.1667 \approx 5.83\text{ units}\)
Projected value in 2000: \(20.8 + 5.83 = 26.63\text{ units}\)
Converting this back to the scale of millions yields approximately 2.66 million, which rounds cleanly to 2.7 million.
1953: The graph starts right at approximately 1.7 million.
1956: The first sharp peak returns exactly to that same height of 1.7 million.
1958–1959: As the line makes its final sharp upward climb towards the 20 mark, it crosses the 1.7 million threshold for the third time.
In 1966, the marriage value is approximately 21 (which corresponds to 2.1 million marriages).
\(\text{Collection from Marriages}=2.1\text{ million}\times \text{Rs }200=\text{Rs }420 \text{ million}\)
Number of Births (Bottom Graph):
In 1966, the birth line settles right at 3.55 million births.
\(\text{Collection from Births}=3.55\text{ million}\times \text{Rs }100=\text{Rs }355\text{ million}\)
Number of Young People (Top-Left Graph):
In 1966, the line sits at approximately 19.25 million young people.
\(\text{Collection from Young People}=19.25\text{ million}\times \text{Rs }20=\text{Rs }385\text{ million}\)
Total Government Collection:
\(\text{Total Collection}=420+355+385=\text{Rs }\mathbf{1160}\text{ million}\)
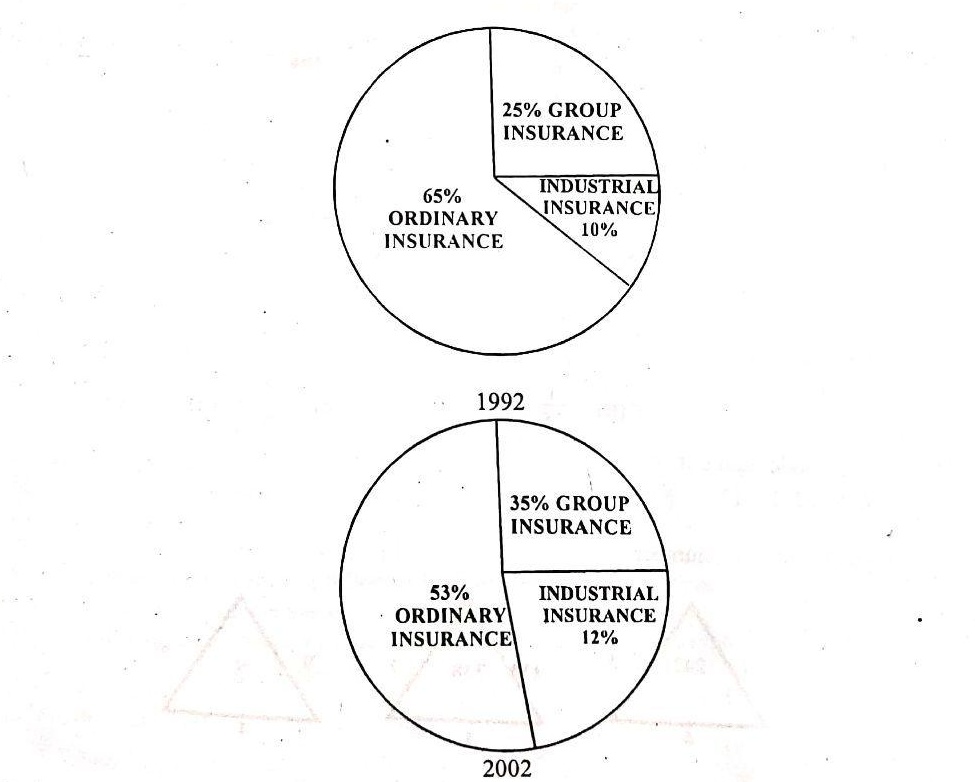
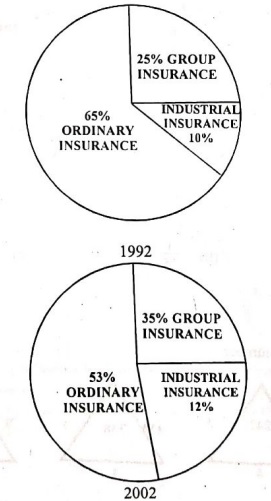
Annual rate of increase: \(\frac{10\%}{10\text{ years}} = 1\%\text{ per year}\)
Projected percentage for 2001 (9 years after 1992): \(25\% + (9 \times 1\%) = 34\%\)
Amount from Group Insurance (out of 50 million):\(50\text{ million}\times 34\%=50\times 0.34=17.0\text{ million}\)
Among the given multiple-choice options, 17.5 (D) is the closest standard approximation used for this dataset.
You have studied the complete question pool with step-by-step rationales. Ready to test yourself?
You have studied the complete question pool with step-by-step rationales. Ready to test yourself?
Right vertex: \(\frac{6}{2} = \mathbf{3}\)
Center: \(11^2 \times 2 = 121 \times 2 = \mathbf{242}\)
Triangle 2:
Right vertex: \(\frac{4}{2} = \mathbf{2}\)
Center: \(13^2 \times 2 = 169 \times 2 = \mathbf{338}\)
Solving for Triangle 3
Using the same pattern where \(\text{Left} = 9\) and \(\text{Bottom} = 4\):
Find the right side (?): \(\text{Right}=\frac{4}{2}=\mathbf{2}\)
Find the center (?): \(\text{Center}=9^{2}\times 2=81\times 2=\mathbf{162}\)
The number in the center is found by multiplying the left and right numbers together, then dividing by the bottom number:
\(\text{Center}=\frac{\text{Left}\times \text{Right}}{\text{Bottom}}\)
Verification
First Triangle:
\(\frac{9\times 7}{21}=\frac{63}{21}=\mathbf{3}\)
Solving for the Second TriangleSecond Triangle:
\(\frac{16\times 21}{42}=\frac{336}{42}=\mathbf{8}\)
First Right Turn: Facing South, turning right at a right angle makes him face West.
Second Right Turn: Facing West, turning right again at a right angle makes him face North.
Cash discount:
1800×0.98=1764.
\(21.3 - 20.8 = 0.5\text{ units}\)
Annual rate of increase: \(\frac{0.5}{3} \approx 0.1667\text{ units per year}\)
Time span from 1965 to 2000: \(2000 - 1965 = 35\text{ years}\)
Total projected increase by 2000: \(35 \times 0.1667 \approx 5.83\text{ units}\)
Projected value in 2000: \(20.8 + 5.83 = 26.63\text{ units}\)
Converting this back to the scale of millions yields approximately 2.66 million, which rounds cleanly to 2.7 million.
1953: The graph starts right at approximately 1.7 million.
1956: The first sharp peak returns exactly to that same height of 1.7 million.
1958–1959: As the line makes its final sharp upward climb towards the 20 mark, it crosses the 1.7 million threshold for the third time.
In 1966, the marriage value is approximately 21 (which corresponds to 2.1 million marriages).
\(\text{Collection from Marriages}=2.1\text{ million}\times \text{Rs }200=\text{Rs }420 \text{ million}\)
Number of Births (Bottom Graph):
In 1966, the birth line settles right at 3.55 million births.
\(\text{Collection from Births}=3.55\text{ million}\times \text{Rs }100=\text{Rs }355\text{ million}\)
Number of Young People (Top-Left Graph):
In 1966, the line sits at approximately 19.25 million young people.
\(\text{Collection from Young People}=19.25\text{ million}\times \text{Rs }20=\text{Rs }385\text{ million}\)
Total Government Collection:
\(\text{Total Collection}=420+355+385=\text{Rs }\mathbf{1160}\text{ million}\)
Annual rate of increase: \(\frac{10\%}{10\text{ years}} = 1\%\text{ per year}\)
Projected percentage for 2001 (9 years after 1992): \(25\% + (9 \times 1\%) = 34\%\)
Amount from Group Insurance (out of 50 million):\(50\text{ million}\times 34\%=50\times 0.34=17.0\text{ million}\)
Among the given multiple-choice options, 17.5 (D) is the closest standard approximation used for this dataset.
You have studied the complete question pool with step-by-step rationales. Ready to test yourself?
Ready to Test Your Retention & Speed?
Now that you have reviewed the study questions and rationales, test yourself in our interactive 1-by-1 practice engine or take the full official timed mock exam.